When will you die?
We can reliably predict by which year half of your age cohort will no longer be living. When that year comes, which half of the cohort will you be in?
Please subscribe; please share. There is no downside because your email will not be used for other purposes. You will receive no advertisements.
Copy and share the link, post it on another platform. It is not that I get money with more subscribers, but it makes me happy when more people read it.
-+-+-+-+
My last post noted that despite above-average health spending in the U.S., health outcomes remain below average. For example, although U.S. per capita spending was double that of Australia and eight times that of Turkey, the average U.S. life expectancy (77 years) was only slightly higher than the Turkish average (76 years) and seven years lower than the Australian average (84 years).
These numbers are alarmingly close to my current age of 69. Using the Turkish norm, I should not expect to see the Brisbane Olympics in 2032.
Reaching a point in life where you measure your remaining years against future events is a sobering experience. It’s like being on vacation and seeing a poster for your favorite band, only to realize they’re playing after you will have already left.
Every year grows a little shorter
Every death comes too soon
As the days increase, they also decrease
(Ezginin Günlüğü, The song of the Galata Bridge)
Her yıl biraz daha kısa
Her ölüm erkendir
Günler çoğaldıkça azalır
(Ezginin Günlüğü, Galata Köprüsünün Şarkısı)
It’s worth delving deeper into the meaning and implications of life expectancy statistics. The first order of business may be determining which cohort I belong to.
I was born in Turkey in 1955. I lived there for 24 years, then spent 3 years in the U.S., and have been in Australia for the past 42 years. Should I use Turkish statistics to calculate my expected life span? Australian statistics? Or a weighted average of all three? According to the literature, none of these approaches is entirely correct. The literature also suggests that while mean life expectancies are useful for governments in planning future pension and healthcare spending, they’re less helpful for personal planning. But let’s set this second point aside for now.
-o-
Life expectancies for the migrants
Using 2016 census data for the population size, and getting the annual death statistics from the Australian Bureau of Statistics (ABS), Huang, Guo, and Taksa (2024) examined the life expectancies and healthy life expectancies of overseas-born and native-born populations in Australia. They found that the overseas-born population generally lives longer.
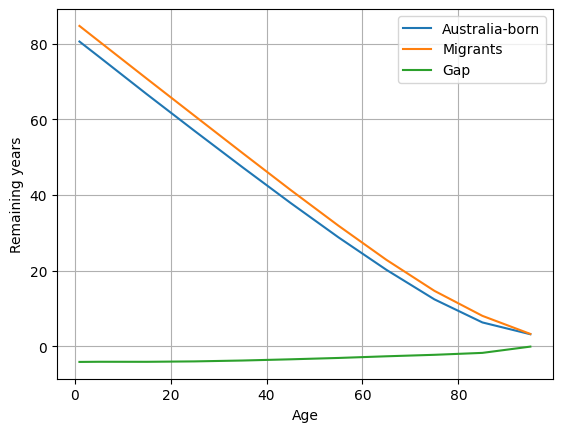
Their study also indicates that the experiences of migrants in the U.S. and Canada are similar to those observed in Australia.
While mean values for large, diverse populations are not useful for personal predictions due to variations in diet, genetics, lifestyle, and exercise habits, they help us understand human mortality and its limits. So, let’s explore how governments track these figures.
-o-
Life Tables
The Australian government publishes population statistics after each census, aiming to make accurate projections for future population numbers to plan pension and health service commitments.
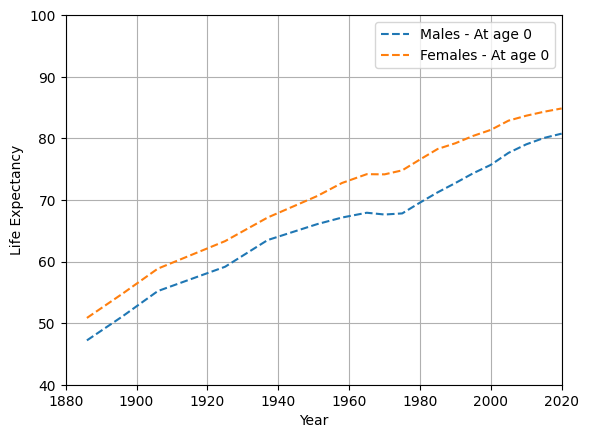
These records show that general life expectancies have steadily improved over the last century. For example, the mean life expectancy for female babies born in 1900 was 57 years. This rose to 74 years for those born in 1960. Male babies experienced a similar improvement in life expectancy although theirs always remained smaller than female babies, with the gap fluctuating over time.
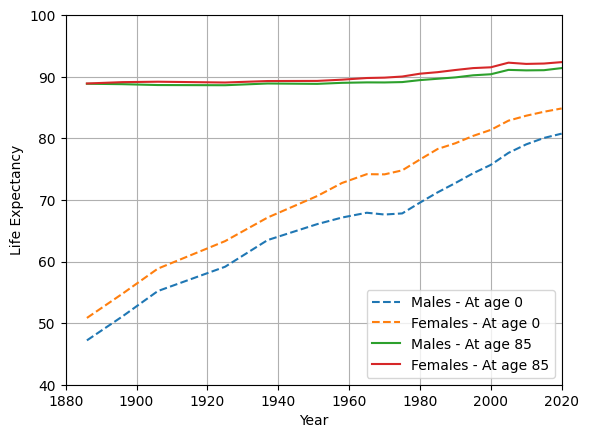
The improvement in life expectancy for older ages has been much slower. For instance, the life expectancy for 85-year-old males in 2000 was similar to that of 85-year-old males in 1885. In other words, if you were born in 1800, you had a much lower expectation to reach 85 but those who did, would expect to live as long as an 85-year old in 2000.
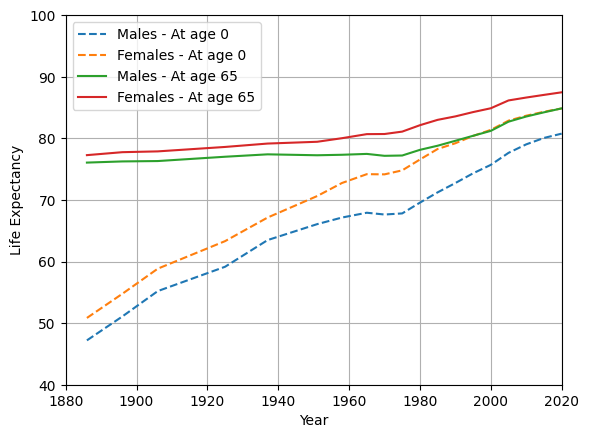
There has been some slight improvement for 65-year-olds:
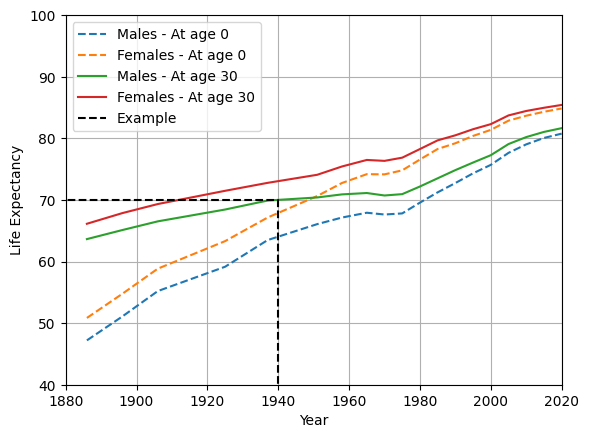
The improvement started earlier in the century for the younger ages, such as 30-year olds:
I have more to say about the relevance of these tables for individuals (spoiler: they have no relevance for individuals) but let me take a look at the Turkish stats first.
-o-
Turkish Statistics
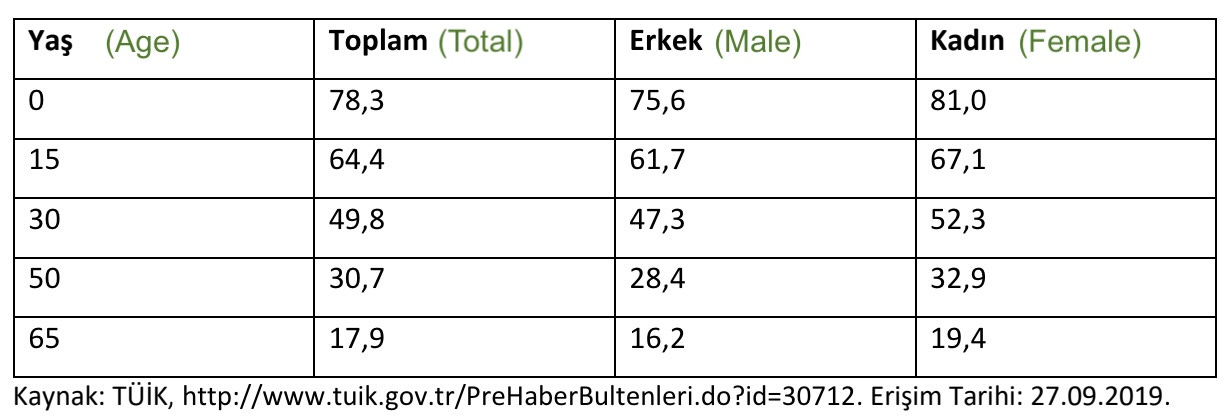
I could not find historical data on life expectancies in Turkey, but I assume the trends would be similar to those in Australia. I could estimate them using the same growth patterns as in Australia adjusted for Turkey’s 2016-2018 figures, which I was able to find on the web:
But there’s no need for for producing Turkish graphs similar to those I generated for Australian numbers above. The main purpose of national life expectancy statistics is to help governments with financial planning. The Australian charts provide no specific guidance for the life expectancy of an individual Australian, and the same would apply to Turkish statistics.
To predict your own life expectancy, you need to consider data from a cohort similar to you in diet, exercise, lifestyle, etc. Your life expectancy would likely be closer to this cohort’s expected value than to the mean value for your nation.
-o-
Gompertz Function
The national life expectancy statistics are generated from mortality data, which represent the number of deaths recorded each year. The shape of the mortality data distribution is best described by the Gompertz function, which expresses the probability that an individual aged x survives to age x+t.
Here, m(x) is the mortality rate at age x and is represented by the Gompetz form as:
m0 represents baseline mortality (or mortality at age 0), and b is a positive constant representing the rate of aging, known as the rate parameter. Evidence suggests that the rate parameter b is about the same for all humans, past and present (explained in Box 1 of Vaupel, 2010). Variations in individual mortality rates are primarily due to differences in m0, which can vary widely.
-o-
Life Expectancy variations
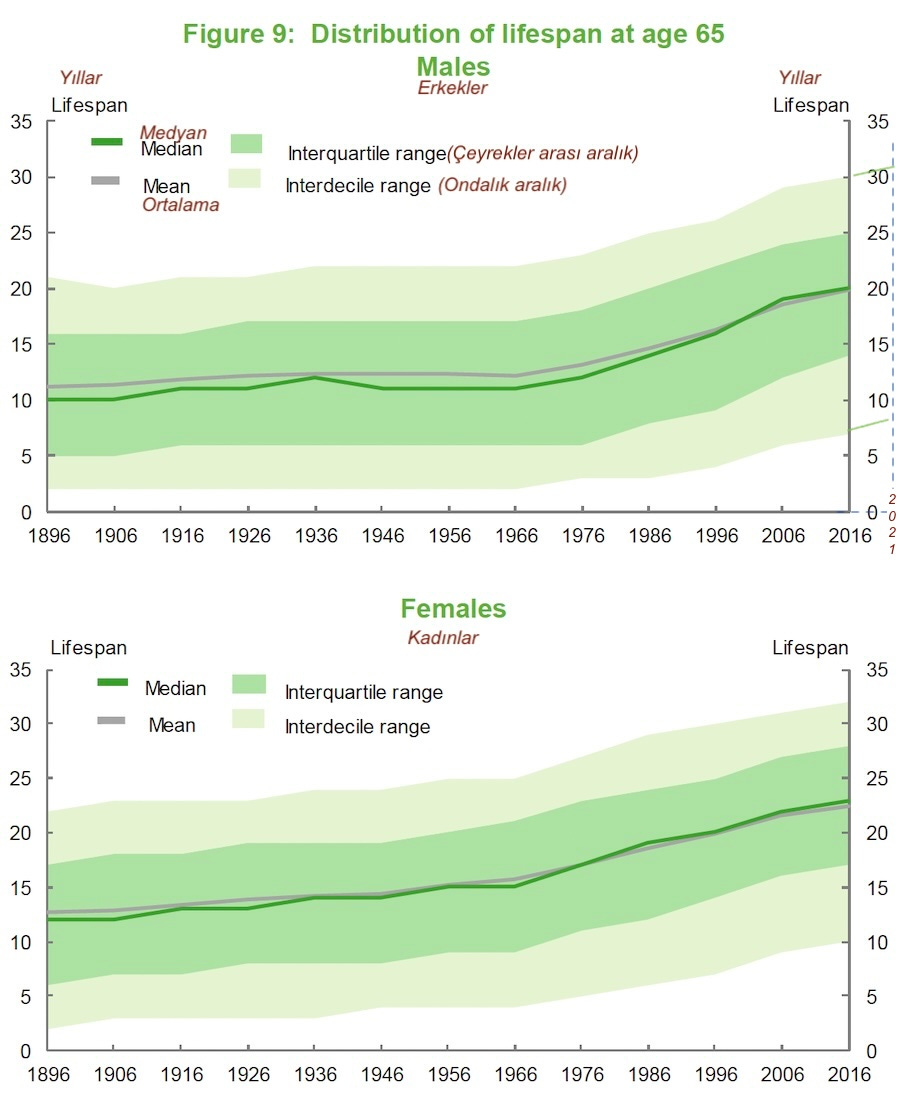
The following figure shows how the expected lifespan varied for 65-year-old Australians over the years. I copied it from the Australian Life Tables 2015-2017.
The shaded region covers 80% of all 65-year-olds in a given year. For instance, I turned 65 in 2021. I had to extrapolate the top figure to 2021, as shown, to estimate the numbers for my vintage. The interquartile range of remaining years for my age is about 15 to 26 years, meaning that 50% of my age cohort in Australia can expect to live 15 to 26 more years after turning 65. This is equivalent to life expectancies ranging between 80 and 91 years. The interdecile range for this same cohort is 8 to 31 years, indicating that 10% of my age cohort will live beyond 96 years, while another 10% will die before reaching 73. It’s a sobering thought.
An individual’s position on this chart depends on their baseline mortality rate m0, which varies from person to person. Past literature lists several physical and genetic features, as well as lifestyle choices, as determinants of an individual’s baseline mortality rate. Some of these include:
Income
Level of education
Wealth
Social status
Race
Smoking
Alcohol consumption
Exercise
Eating habits
Drug use
Emotional status
Genetics account for about 25% of the variation (Vaupel, 2010), though it’s unclear which genes are responsible. Peter Attia argues that physical activity and exercise are the most important determinants, followed by diet (Attia, Outlive, 2023).
-o-
Conclusion
National life tables are important primarily for governments, who need them to plan and budget for future pension and healthcare spending.
All humans, regardless of race or nationality, age at the same rate. They die at different times because their health deteriorates at different rates, due partly to genetic factors (20-25%) but mainly due to lifestyle choices. In other words, most people die because they run out of health.
The genetic and lifestyle variations account for a spread of [+50% of the mean, -60% of the mean] in the interdecile range around the mean life expectancy for 65-year-old males in Australia. The spread may vary slightly in other national cohorts due to genetic and lifestyle differences in those nations.
While we can’t change our genes, we can change how we live, eat, drink, exercise, and sleep.
Most people agree that healthspan—the period of life spent in good health—is as important, if not more so, than total lifespan. It only became obvious to me while writing this post that increasing healthspan will significantly increase lifespan.
This is clearly an area of existential importance. I will continue to follow the literature and plan to start a Substack chat platform to discuss personal beliefs, preferences, and experiences in health matters.
You will not die because you run out of time. You will die because you run out of health.
References
Attia, P., Outlive: The Science & Art of Longevity, 482 pages, Penguin, 2023.
Australian Life Tables 2015-2017
Huang, G., Guo, F., Taksa, L. et al. Decomposing the differences in healthy life expectancy between migrants and natives: the ‘healthy migrant effect’ and its age variations in Australia. J Pop Research 41, 3 (2024). https://doi.org/10.1007/s12546-023-09325-8
Vaupel, J. Biodemography of human ageing. Nature 464, 536–542 (2010). https://doi.org/10.1038/nature08984
-+-+-+-+
Short Takes
More Boeing Blues
The Boeing Starliner capsule launched on June 5, 2024, carrying NASA astronauts Butch Wilmore and Suni Williams to the International Space Station (ISS). It was supposed to be a one-week mission but the capsule broke. At first, Boeing and NASA officers played the glitches down but no more. The likely option is now for the astronauts to be brought back on SpaceX’s Crew Dragon in February 2025. The Starliner capsule will have to be dislodged from the ISS to make space for the SpaceX Crew Dragon and probably dumped in space.
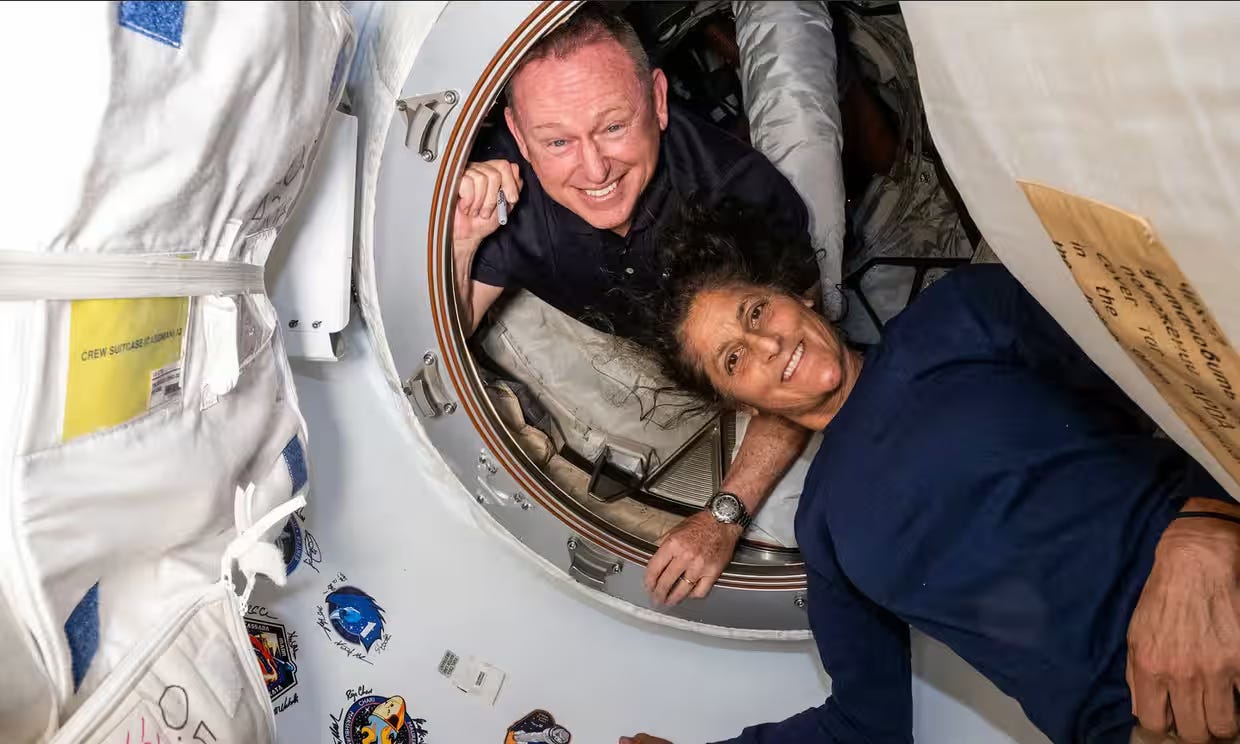
This is a major embarrasment for Boeing in a project in it is already said to have lost more than $1.5 billion by delays, management issues and engineering challenges. The first crewed flight of the Starliner was supposed to take place in 2017. This did not happen. The June 2024 launch was the first crewed flight of the Starliner.
If Starliner project is abandoned, this would be second major unsuccessful product for Boeing in the last two decades. The other one is Boeing 737 MAX, which was grounded for two years by FAA following fatal crashes. It has been recertified but still is finding it difficult to get new sales. The following are the Boeing 737 MAX 9 planes in operation as of January 2024 from a Statista page:
PS: On Aug 14, I read the news that a Russian cargo spacecraft sets off from Kazakhstan to resupply the International Space Station. It is not equipped to transport humans.
-+-+-+-+
You Tube
I came across this video while I was putting together the first section on life span and stuff. The video is about an initiative of a local university in Antalya, Turkey, being offered to the elderly. There are regular classes as well as practical training on art and carpentry:
I loved it. I wished my university had the resources to do something similar here in Brisbane. Interestingly, the video was broadcast by CGTN of China.
Diary
Walking around the neighborhood
The latitude of Brisbane is -27.4°, about 4° south of the Tropic of Capricorn. In the Northern hemisphere, +27.4° goes through the Sahara and Arabian deserts.
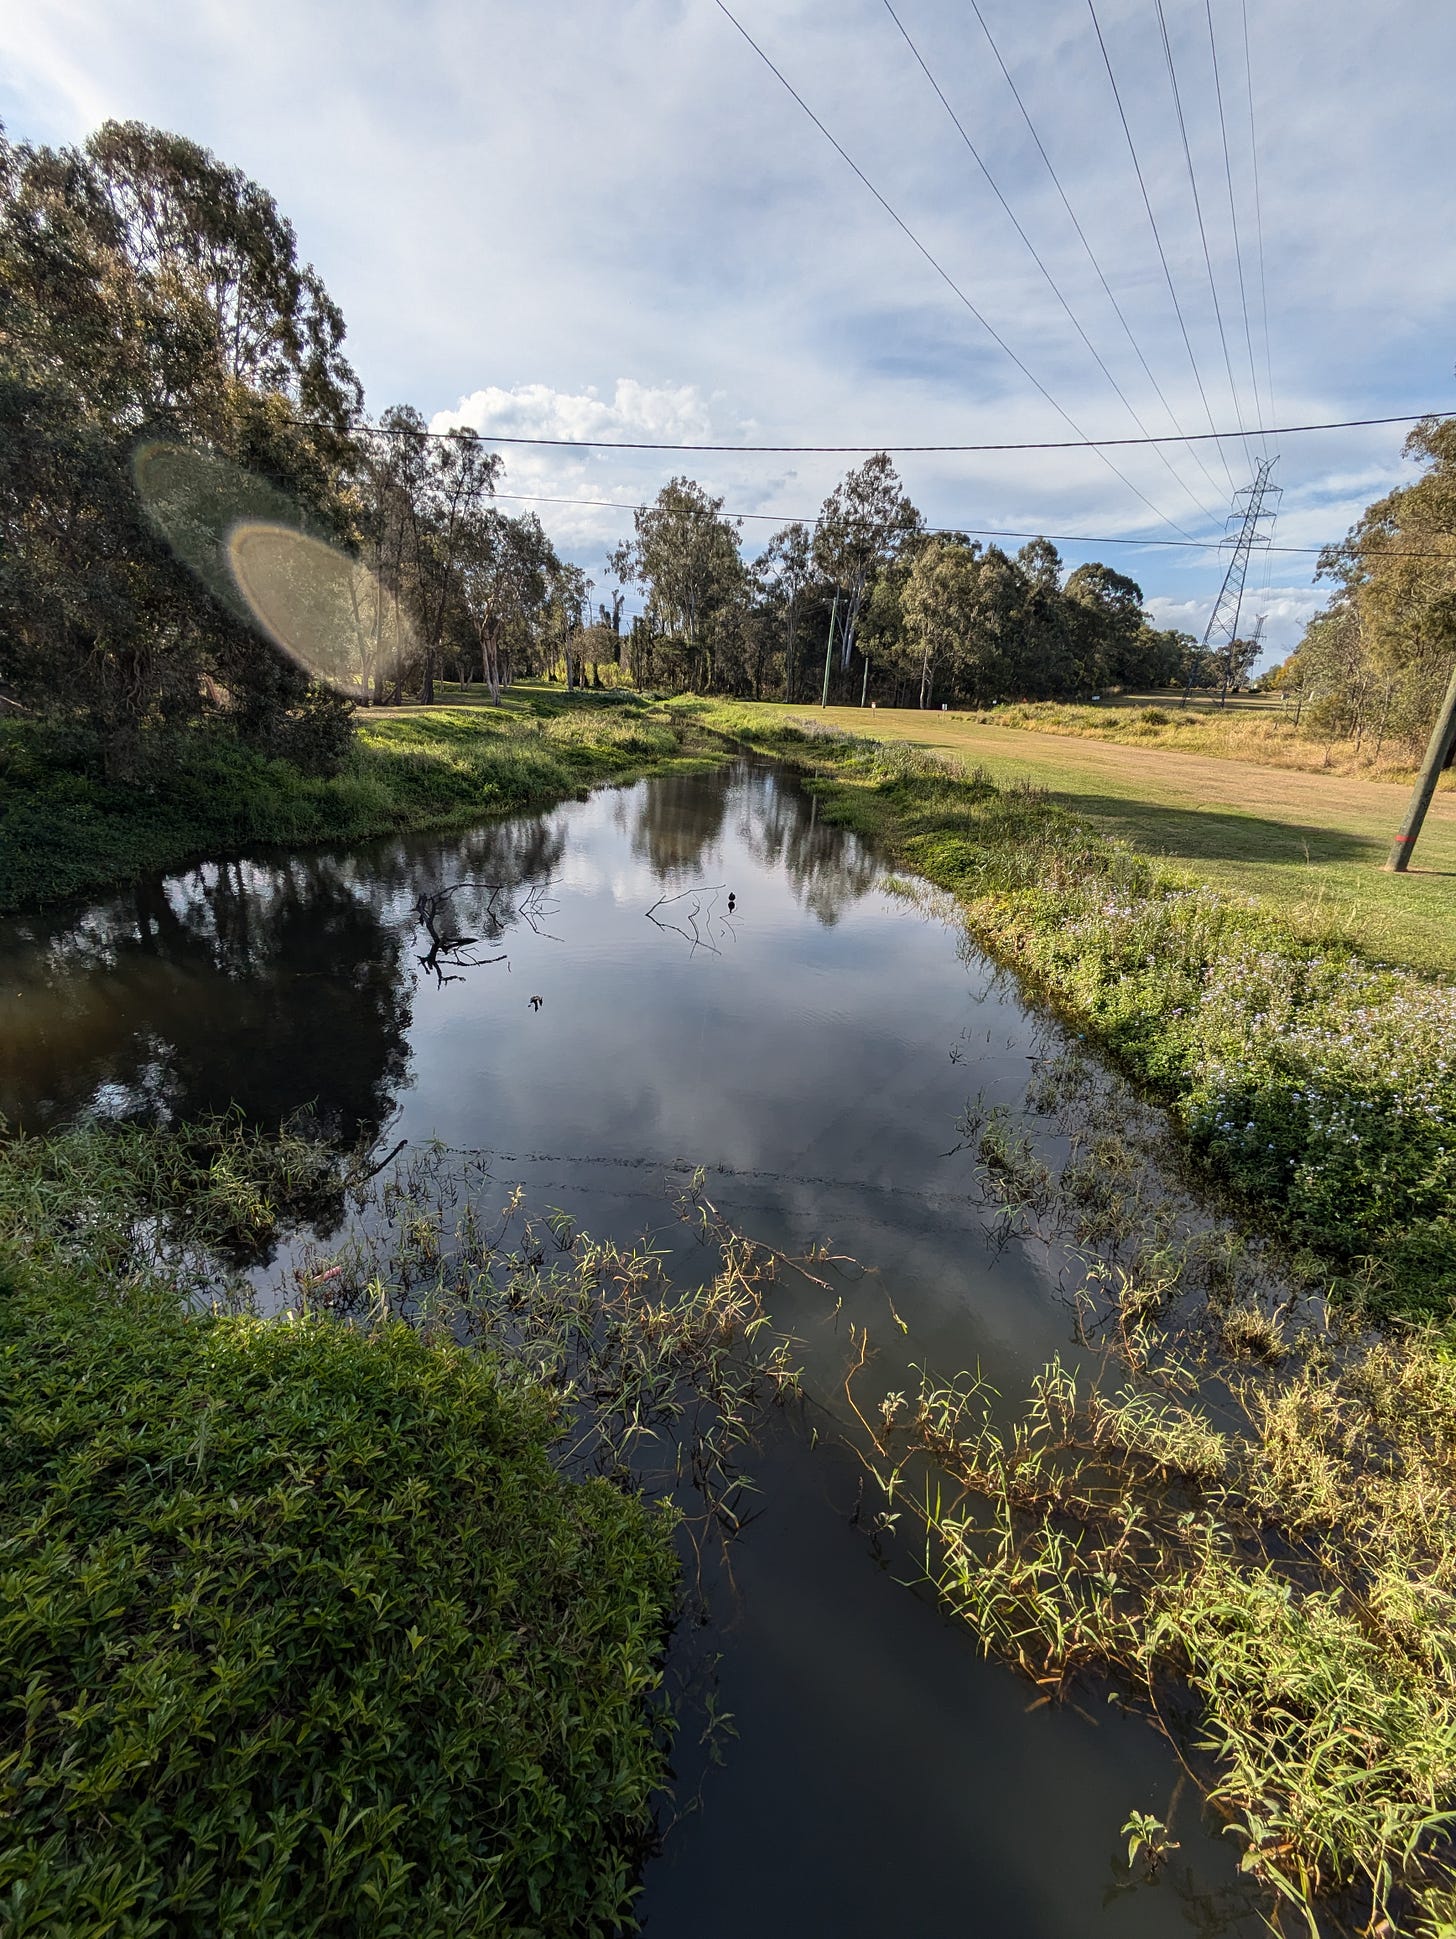
The little creeks around the area where we live have water only after it rains.
The land around the creeks is usually vacant probably to provide relief when it floods.
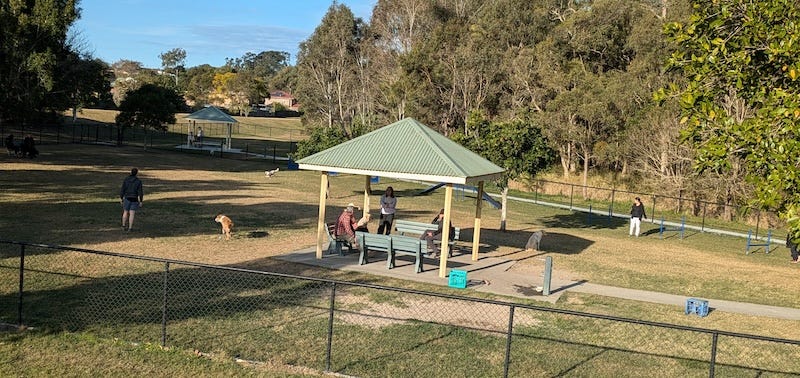
One notes different features of Brisbane suburban life when walking around. For example, here are people exercising their animals unleashed in this enclosed dog park:
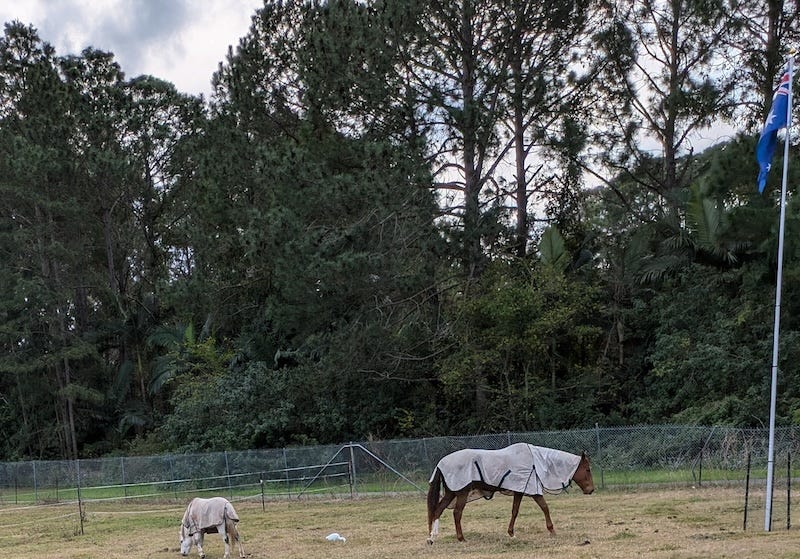
Here is a horse farm. I think the small animal is a pony:
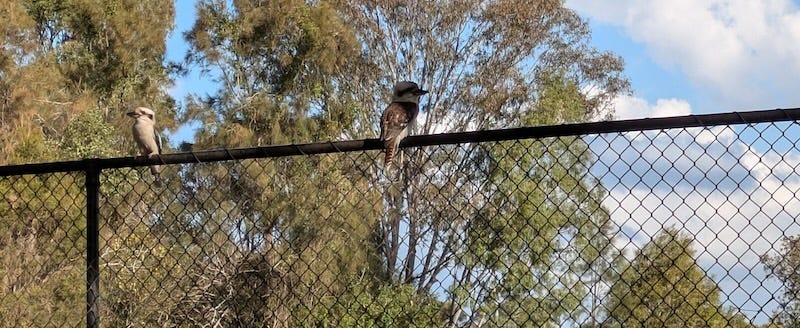
Here are two kookabarras sitting on the fence of a local field:
The most distinguishing feature of kookaburras is their sound.
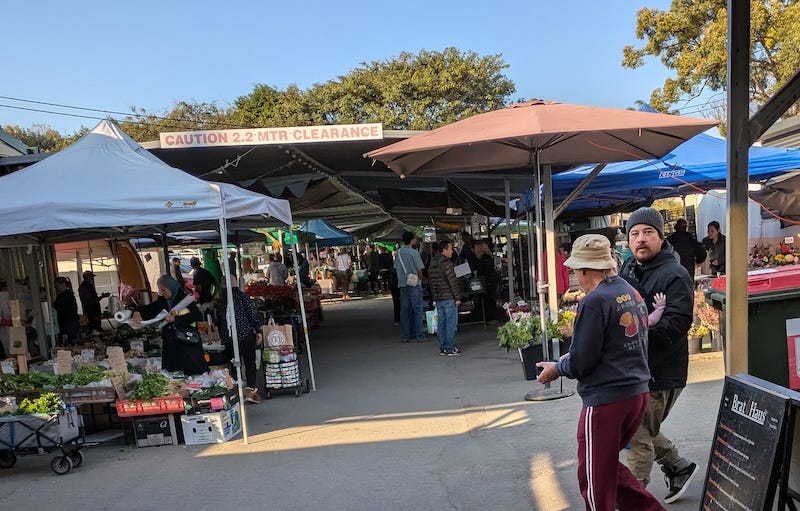
Mt Gravatt Farmers Market
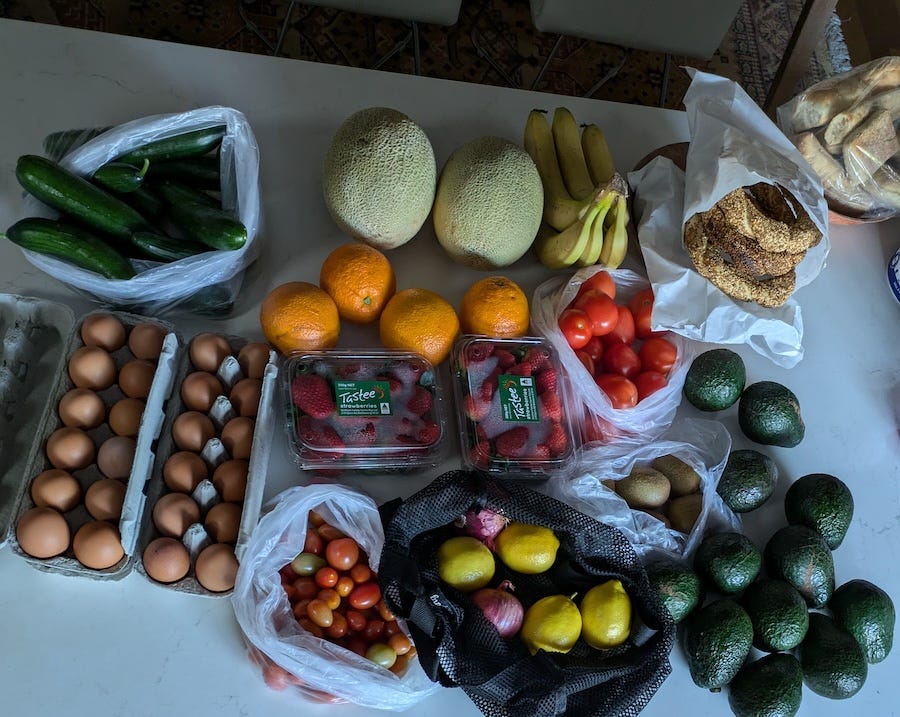
The tomatoes are getting better as we are coming out of winter. Last week there was a shortage of good avocados but I had no problem finding avocados this week. Here is what I brought home from the market:
I always try to shop from the same people in the market. The tomatoes and avocadoes are from a Cambodian couple who have a farm in Logan. I usually buy my cucumbers from them too but they did not have any this week so I bought from someone else. The lemons, red onions, and the eggs are from a grandmother farmer living on a property near Mt Cotton. The simits (Turkish sesame bagels) are from Ömer and wife. The bananas are also from around Brisbane. The banana seller tells me every time that they have to spray the bananas in North Queensland against pests but not in Brisbane because Brisbane never gets that hot and there are no banana pests hence his bananas are pesticide-free. He may be telling the truth.
Here is a photo from last Sunday:
Tuesday dinner
Last Tuesday, the butcher had good rib fillet steaks supplied by the nearby Eight Miles Plains slaughterhouse. I favour their meat against the other sort the butcher sells. Here they are on the grill after having been marinated in olive oil for two hours. The flames are from the olive oil drops.
Here is Eleanor’s fruit plate. She has fruit in the mornings after her egg on toast. The oranges and the strawberries are from Mt Gravatt’s market. The local farmers do not grow blueberries and golden Kiwi, so I buy them from the supermarket:
Pascal Hagi
They had a treat last night. Meliz microwaved them carrot:
What I read
America: The Farewell Tour by Chris Hedges
Chris Hedges is a Pulitzer Prize–winning journalist who spent fifteen years as a foreign correspondent for The New York Times, where he served as the Middle East Bureau Chief and Balkan Bureau Chief. He previously worked overseas for The Dallas Morning News, The Christian Science Monitor, and NPR. His book, America: The Farewell Tour, was published in 2019.
In the 1970s, dystopian novels set in desolate landscapes resembling a post-catastrophe USA were common. Dhalgren by Samuel Delany comes to mind, as well as Ballard’s The Drowned World. Chris Hedges’ book, America: The Farewell Tour, evokes those dystopian themes, except this one is grounded in reality.
The book opens with a visit to the remnants of the Scranton Lace Company:
The factory, started in 1891, was once among the biggest producers of Nottingham lace in the world. When it closed in 2002—the company’s vice president appeared at mid-shift and announced that it was shutting down immediately—it had become a ghost ship with fewer than fifty workers. On the loom before me, the white lace roll sat unfinished.
America: The Farewell Tour (p. 7). Simon & Schuster. Kindle Edition.
Hedges uses the Scranton Lace Company as a metaphor for the United States, drawing parallels between the company’s decline and the perceived decline of American society. He later provides statistics and examples to illustrate how the country, much like the Scranton Lace Company, has experienced deindustrialization, job loss, economic instability, and the disintegration of communities that once thrived around these industries.
While highly critical of Trump, Hedges is no friend of the Democratic establishment either. He is a harsh critic of self-identified liberals like Bill and Hillary Clinton and Barack Obama, accusing them of paying lip service to liberal democratic values while, in reality, undermining these values in service to corporate power.
Chris Hedges is a skilled journalist, and the strength of this book lies in how he narrates the devastation of American society through interviews with people who are experiencing it firsthand. Through the stories of real individuals, we learn about the insidious decay of society brought on by drugs, gambling, and pornography, and how frustrated people are driven to extremes and manipulated by demagogues on online platforms.
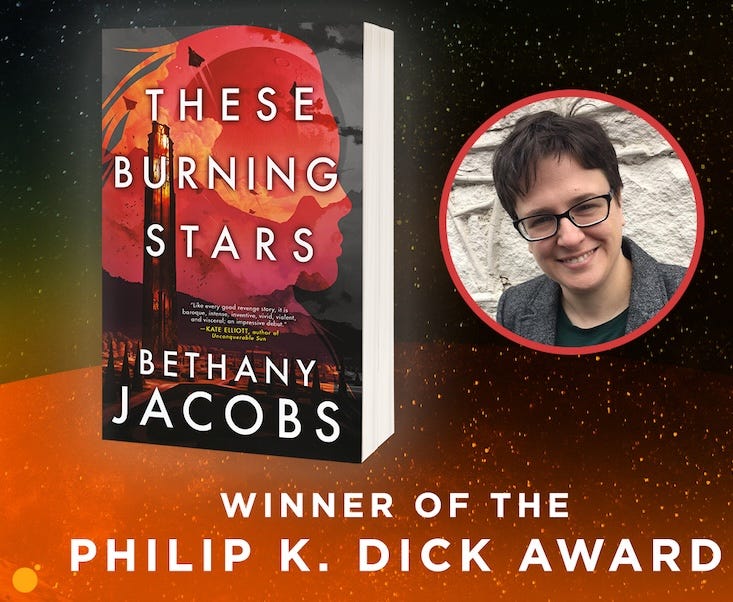
These Burning Stars by Bethany Jacobs
Bethany Jacobs, a former college instructor living in Buffalo, New York, was awarded the 2024 Philip K. Dick Award for this debut novel. The story is set in a remote cluster of stars known as the Treble. We learn that many years ago, humans arrived in one of these stars aboard a slower-than-light generation ship. They discovered a “magical” material on the moon of a planet that enabled faster-than-light travel.
The narrative unfolds across three solar systems, but because of nearly instantaneous travel, they can be thought of as different regions on the same planet. All three planets are governed by the “Kindom,” a triumvirate composed of three “Hands,” who are the leaders of the three branches of government: Clerics (Priests), Cloaksaan (Assassins), and Secretaries (Judiciary). Additionally, there are powerful family corporations that exert significant influence.
This is a very well-written book. Other critics have described the prose as dark and evocative, perfectly matching the tone of the story and the brutal realities of the world it portrays. The characters are intriguing, and the book concludes on a note that promises an exciting sequel.
AT Index
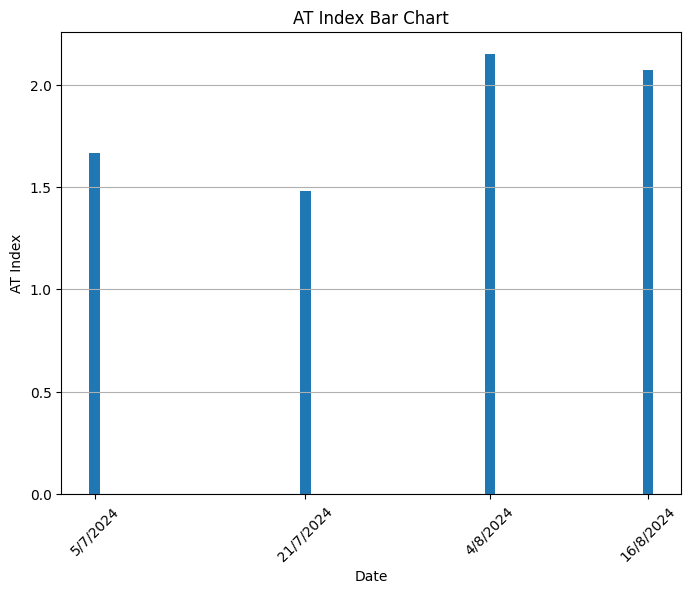
Based on my basket of goods, Australia is twice as expensive this week compared to Istanbul. Below are the prices in Turkish liras for the items in the basket on 4 August 2024. The conversion rate is 1AUD=21.54TRY.
The following is the plot of AT index. The height of the bar represents how more expensive Australia is. If the prices were equal, then the bar height would have been 1.00. Australia this week is 208% more expensive than Turkey.
The code to create the above tables and the plot is in my github repository and can be downloaded if you are interested.


